『近似ベイズ計算によるベイズ推定』の逐次モンテカルロ法を R で実装してみました。 Sisson et al. (2007) で例示されている 2 つの正規分布  ,
,  の混合分布からのサンプリングを行います。
SAMPLE_COUNT <- 1000
TOLERANCE <- c(2, 0.5, 0.025)

perturb <- function(x) rnorm(length(x), x, 1)
getDistance <- function(theta) abs(ifelse(runif(1) <= 0.5, rnorm(1, theta, 1), rnorm(1, theta, 0.1)))

dataset <- lapply(TOLERANCE, function(e) c())
while(length(dataset[[1]]) < SAMPLE_COUNT) {
   theta <- runif(1, -10, 10)
   distance <- getDistance(theta)
   if (distance <= TOLERANCE[1]) {
      dataset[[1]] <- c(dataset[[1]], theta)
   }
}
for (i in 2:length(TOLERANCE)) {
   while (length(dataset[[i]]) < SAMPLE_COUNT) {
      theta <- perturb(sample(dataset[[i-1]], 1))
      distance <- getDistance(theta)
      if (distance <= TOLERANCE[i]) {
         dataset[[i]] <- c(dataset[[i]], theta)
      }
   }
}
論文にしたがって最初の集団をサンプルするための分布と事前分布を一致させ,推移核は対称の正規分布を用いています。正規分布の分散についての記述がなかったのでここでは 1 にしてあります。小さい値 (例えば 0.1) をとると中心に偏ったサンプルになるので試してみてください。
getDistance は原著通りなら ifelse(runif(1) <= 0.5, rnorm(1, theta, 1), mean(rnorm(100, theta, 1))) ですが,同じことなので計算量を減らしています。
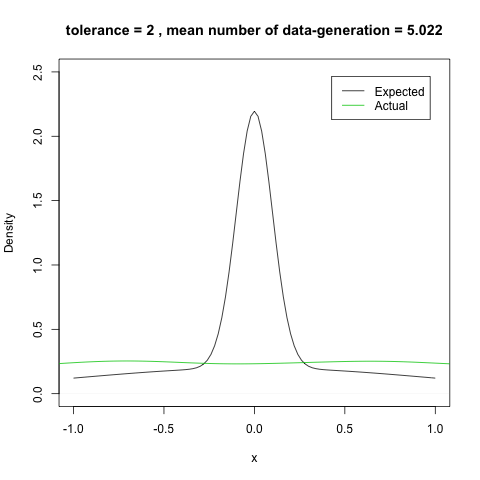
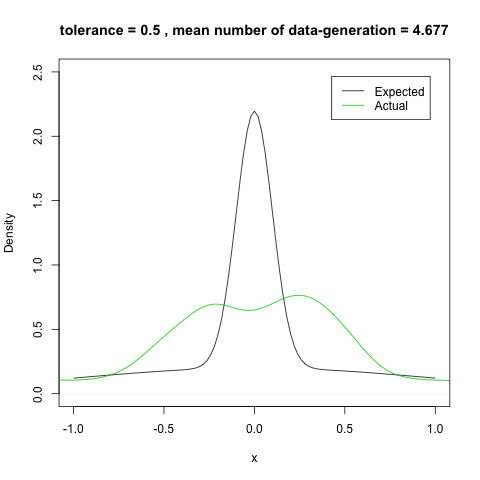
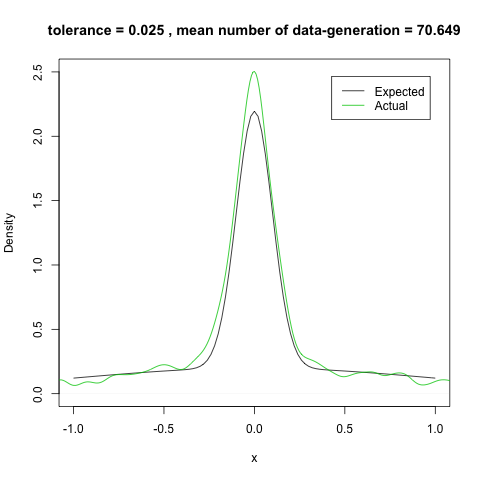
途中結果を示すために dataset に途中の状態もすべて保存していますが,本来なら必要ありません。これをプロットすると次のようになります。
高速化
[2011-06-02 21:30+0900 追記] ベクトル化することで多少速くしてみました。
SAMPLE_COUNT <- 1000
TOLERANCE <- c(2, 0.5, 0.025)

perturb <- function(x) rnorm(length(x), x, 1)
getDistance <- function(theta) sapply(theta, function(t) abs(ifelse(runif(1) <= 0.5, rnorm(1, t, 1), rnorm(1, t, 0.1))))

dataset <- lapply(TOLERANCE, function(e) c())
while(length(dataset[[1]]) < SAMPLE_COUNT) {
   theta <- runif(SAMPLE_COUNT - length(dataset[[1]]), -10, 10)
   distance <- getDistance(theta)
   dataset[[1]] <- c(dataset[[1]], theta[distance <= TOLERANCE[1]])
}
for (i in 2:length(TOLERANCE)) {
   while (length(dataset[[i]]) < SAMPLE_COUNT) {
      theta <- perturb(sample(dataset[[i-1]], SAMPLE_COUNT - length(dataset[[i]]), TRUE))
      distance <- getDistance(theta)
      dataset[[i]] <- c(dataset[[i]], theta[distance <= TOLERANCE[i]])
   }
}
私の環境だと次のように高速化できました。
> system.time(before())
   ユーザ   システム       経過
     4.681      0.011      4.700
> system.time(after())
   ユーザ   システム       経過
     3.341      0.009      3.358
もっと高速化
[2011-08-15 19:00+0900 追記] 距離の算出でベクトル化されていない部分を修正してさらに高速化しました。
SAMPLE_COUNT <- 1000
TOLERANCE <- c(2, 0.5, 0.025)

perturb <- function(x) rnorm(length(x), x, 1)
getDistance <- function(theta) {
   n <- length(theta)
   abs(theta + rnorm(n) * (0.1 + 0.9 * (runif(n) <= 0.5)))
}

dataset <- lapply(TOLERANCE, function(e) c())
while(length(dataset[[1]]) < SAMPLE_COUNT) {
   theta <- runif(SAMPLE_COUNT - length(dataset[[1]]), -10, 10)
   distance <- getDistance(theta)
   dataset[[1]] <- c(dataset[[1]], theta[distance <= TOLERANCE[1]])
}
for (i in 2:length(TOLERANCE)) {
   while (length(dataset[[i]]) < SAMPLE_COUNT) {
      theta <- perturb(sample(dataset[[i-1]], SAMPLE_COUNT - length(dataset[[i]]), TRUE))
      distance <- getDistance(theta)
      dataset[[i]] <- c(dataset[[i]], theta[distance <= TOLERANCE[i]])
   }
}
私の環境だと次のように高速化できました。
> system.time(first())
   ユーザ   システム       経過
      4.84       0.00       4.89
> system.time(second())
   ユーザ   システム       経過
      3.48       0.00       3.48
> system.time(third())
   ユーザ   システム       経過
      0.05       0.02       0.06
ポイントは ifelse を使わないことです。おそらく ifelse を使うことで判定ごとに結果を返しているのだと思います (未確認)。一般に ifelse(runif(n) <= p, a, b) は b + (a - b) * (runif(n) <= p) と書き換えることで高速化が可能です。理由は単純で, logical ベクトルの要素 TRUE および FALSE が numeric ベクトルに変換されるとそれぞれ 1 および 0 に変換されるためです。


